Explorations Product
Knowledge graph exploration tool — full product lifecycle
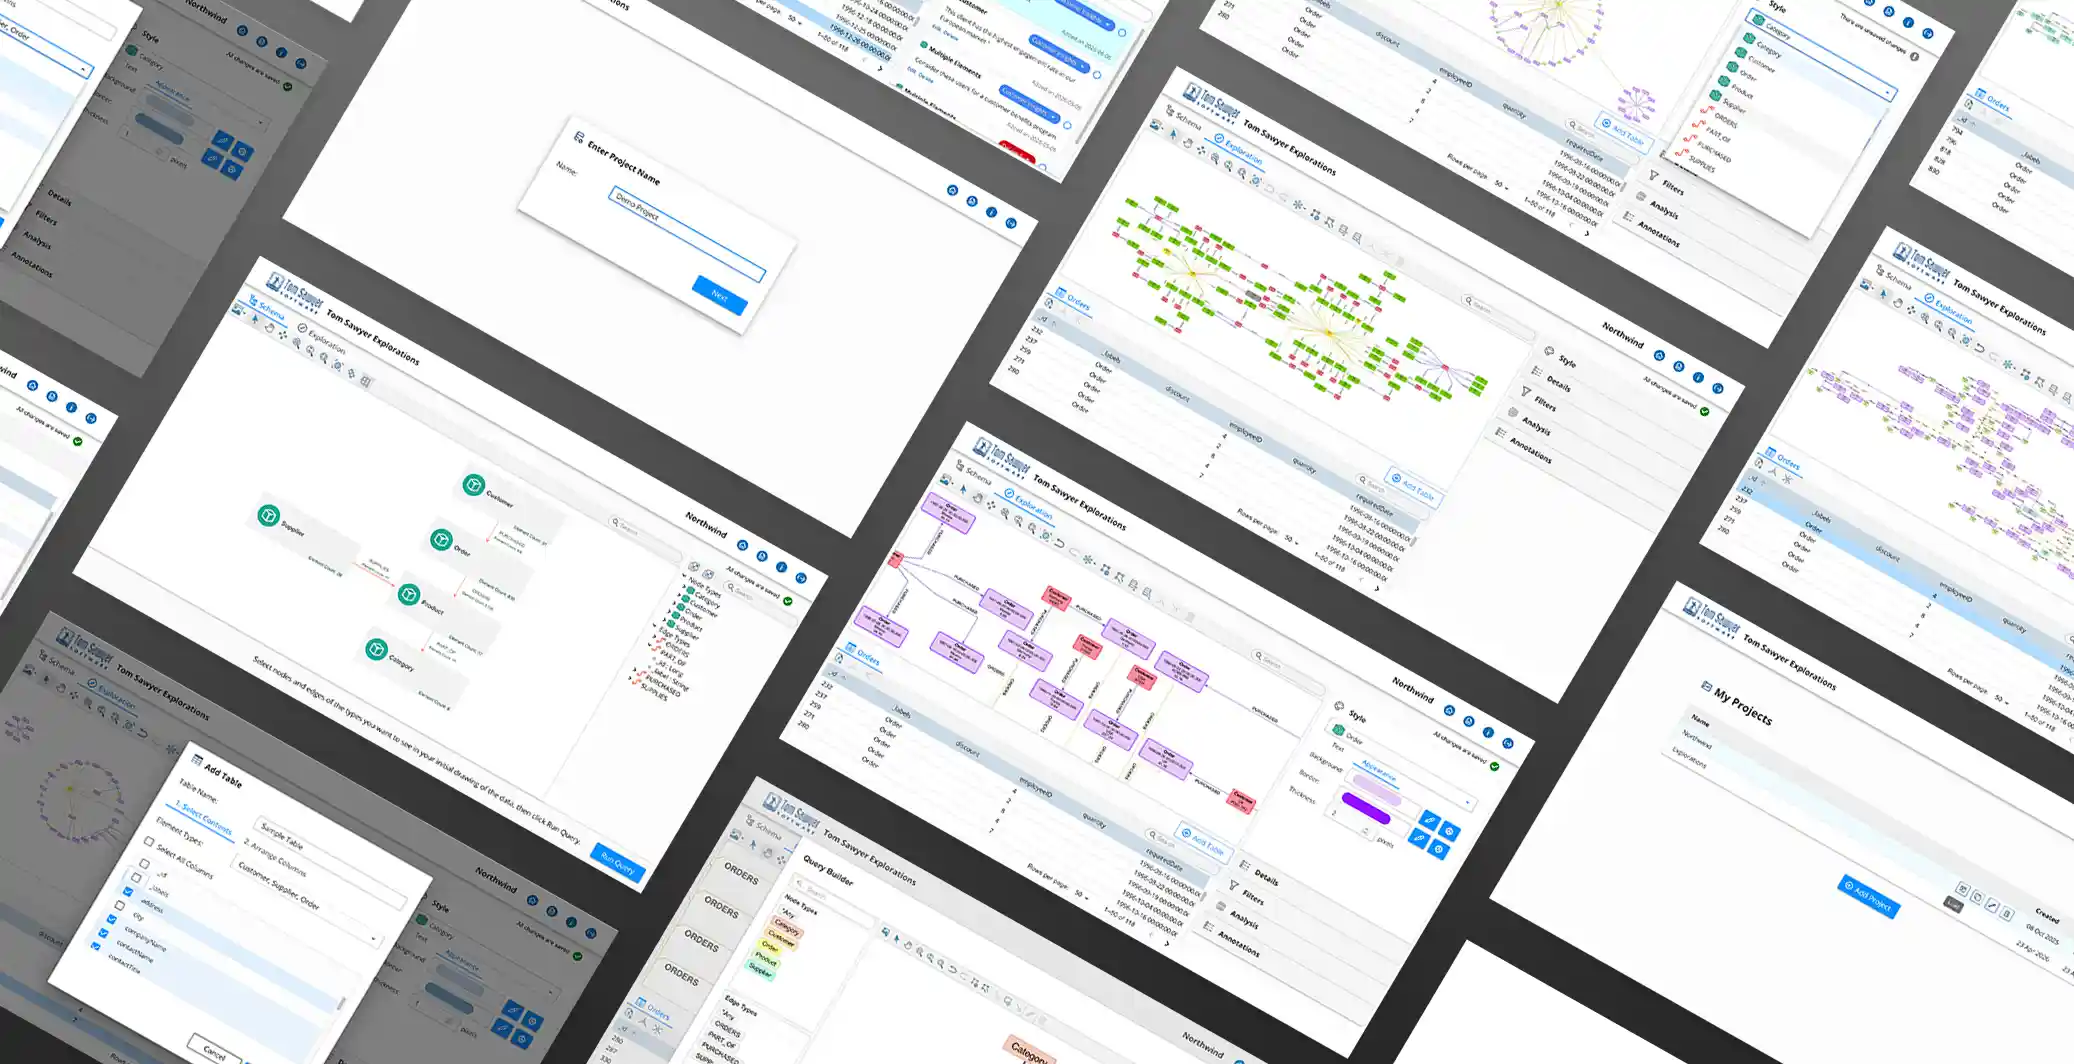
OVERVIEW
Tom Sawyer Explorations is a graph intelligence application that lets analysts uncover insights through data integration, graph pattern matching, and advanced graph visualization, without writing code.
As product designer, I owned the full product lifecycle of the interface, from user understanding and requirements to wireframes, prototypes, and developer handoff. The goal was to make complex graph analysis accessible and intuitive for analysts at every technical level, in a data-dense enterprise B2B product.
THE CHALLENGE
Democratized graph exploration. Removed the need for Gremlin or Cypher expertise, so analysts can explore and query graph databases visually.
Balanced functional complexity. Designed a dual-priority interface that keeps advanced analytical power while staying seamless for non-technical users, simplifying complexity without losing depth.
Cross-functional stakeholder alignment. Worked closely with engineering and product leadership to ensure technical feasibility and keep the design tied to business objectives.
MY PROCESS
User Understanding
Gathered insight into analyst workflows and pain points through close collaboration with product management, a senior technical design manager, and project managers, to find where the learning curve and query construction could be simplified.
Defining Requirements
Partnered with product managers to translate business goals into user needs, and broke technical requirements down into actionable design objectives.
Design Exploration
Compared multiple layout directions through direct iteration with the product development team and manager review, focused on intuitive navigation and visual clarity, within the technical constraints raised by developers.
Collaboration & Refinement
Worked closely with developers to validate feasibility and implementation, and adapted solutions to performance considerations and system limitations.
Original screens, data, and working files from this project are confidential and can't be shared. Process artifacts shown here are recreated to protect confidential project materials. I'm happy to walk through the full process in conversation.
OUTCOME
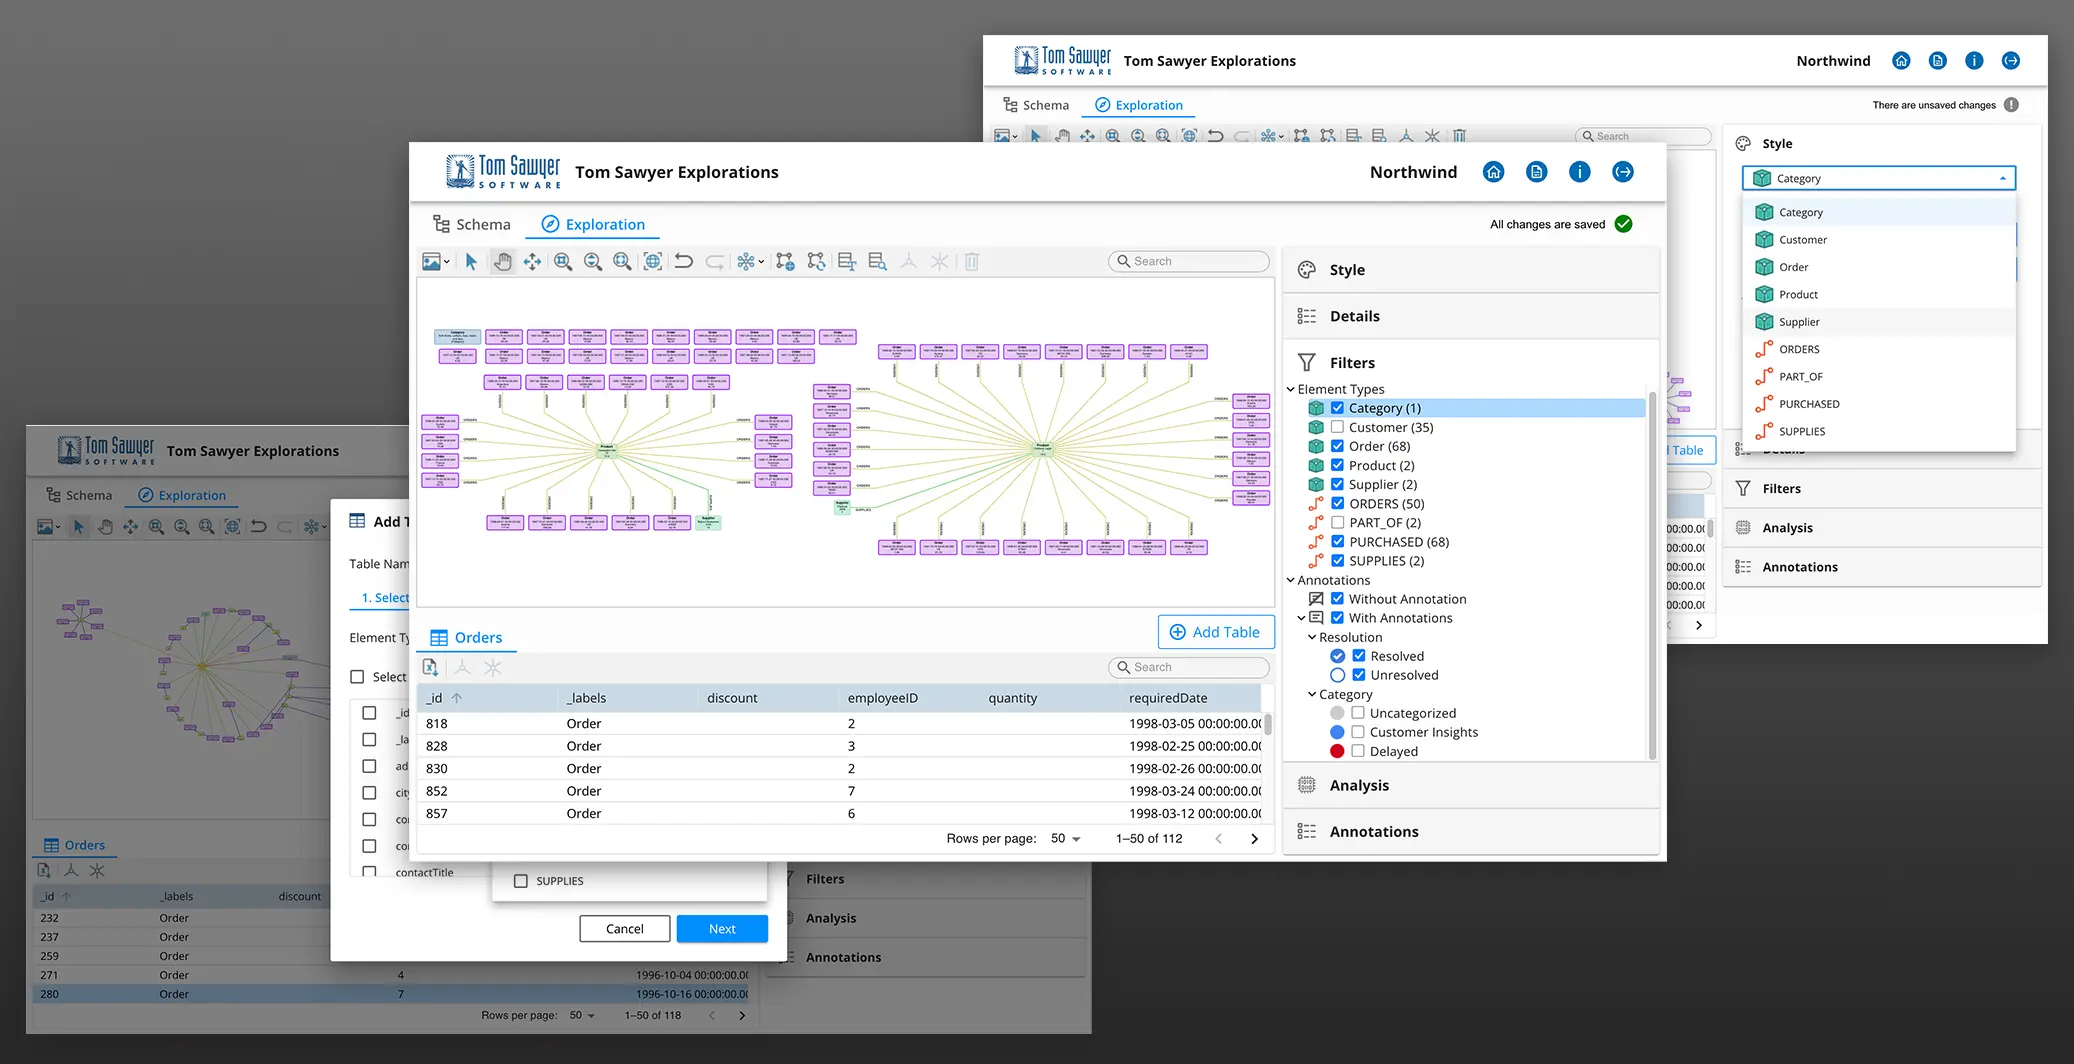
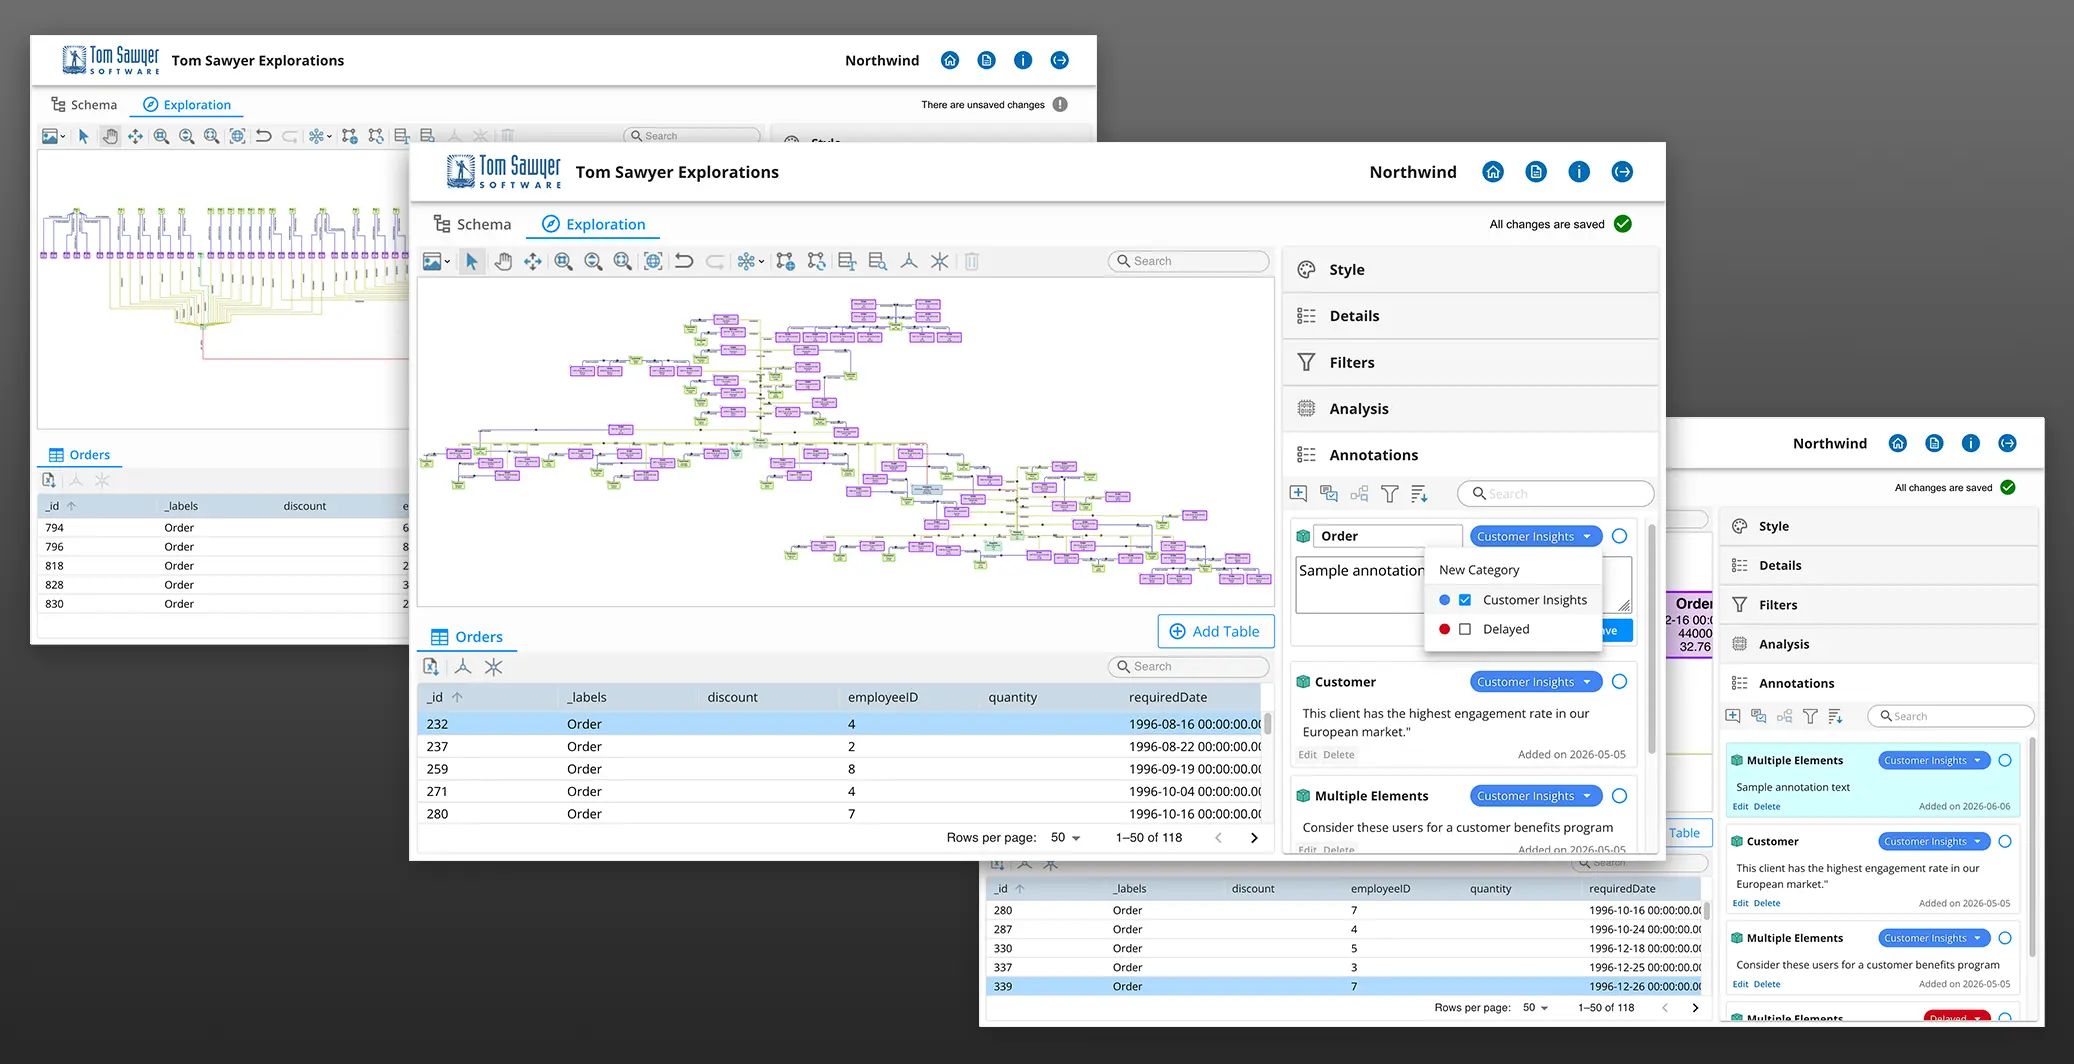
Intuitive visual discovery. A streamlined exploration interface where analysts connect databases, build queries, and visualize relationships without specialized coding skills.
Lowered technical barriers. Successfully reduced reliance on complex query languages: the application doesn’t require code, and colleagues across the company who don’t code can use it.
Advanced analytics, made accessible. Redesigned the analysis and filters panel so graph algorithms from the core platform are easy to apply and read.
Strategic design synthesis. Bridged enterprise technical requirements and a user-centered experience.
SKILLS
Product design, UX/UI design, interaction design, information architecture, wireframing, prototyping, data visualization, graph visualization, design systems, design tokens, enterprise SaaS, B2B analytics, cross-functional collaboration, developer handoff